Create Correlation Matrix
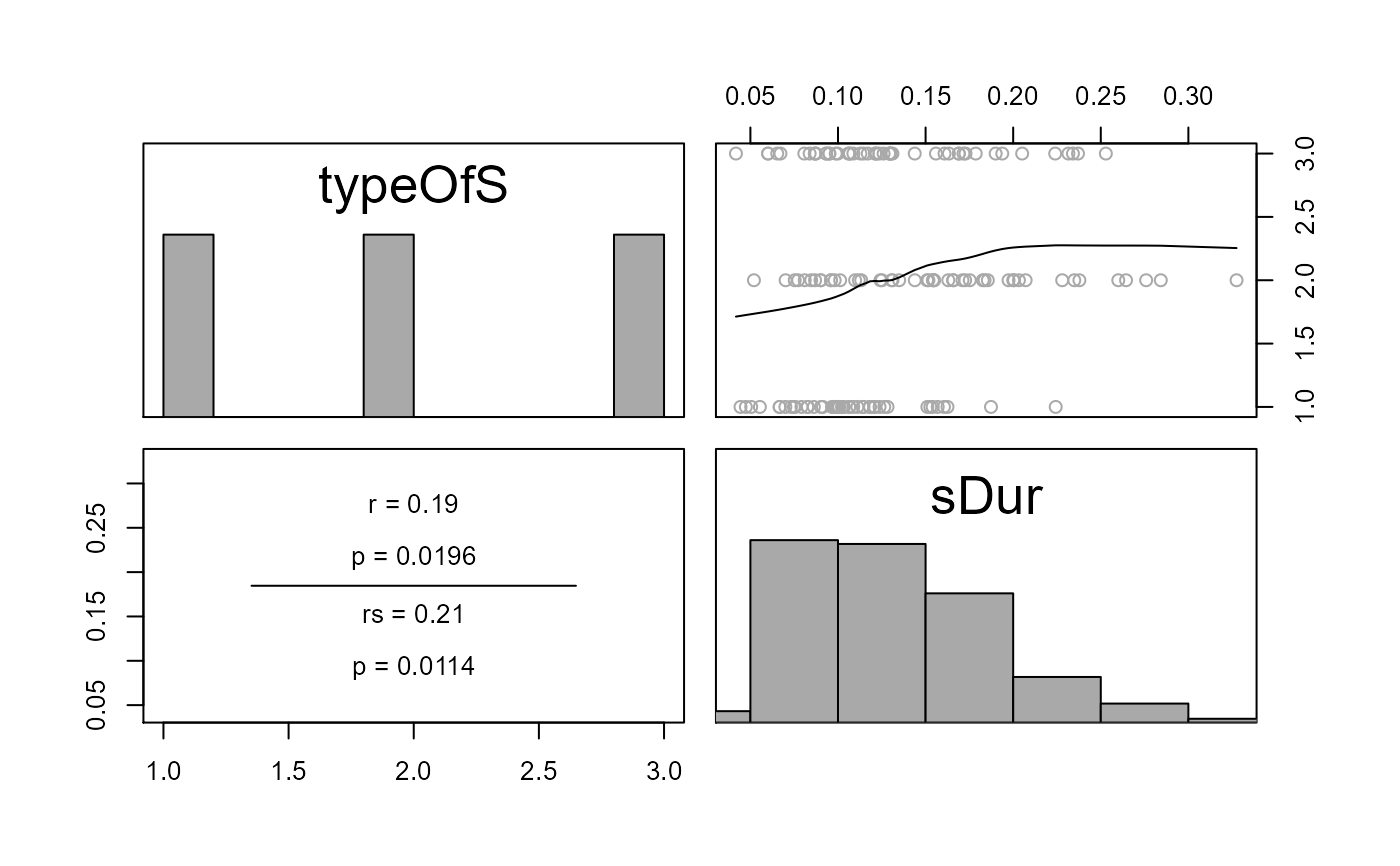
correlation_matrix.RdThis is a wrapper for languageR::pairscor.fnc. A matrix of scatter plots is produced with
Pearson and Spearman correlations in the lower triangle. Fall back to the original function to specify additional arguments.
correlation_matrix(
  data,
  variables,
  hist = TRUE,
  smooth = TRUE,
  size = 1,
  color = "darkgrey"
)
Arguments
- data
The data set containing the variables to be plotted.
- variables
The variables used in the plot. Note: Variables cannot be of type 'character'.
- hist
A logical indicating whether panels on the diagonal should contain a histogram.
- smooth
A logical indicating whether panels in the upper triangle should have a smoother added.
- size
A number indicating the size of the points in the panels in the upper triangle, available only when smoothers are added.
- color
A number or string indicating the color of the points in the panels in the upper triangle, available only when smoothers are added.
Value
Nothing. Creates a plot.
References
Baayen, R. H, & Shafaei-Bajestan, E. (2019). languageR: Analyzing Linguistic Data: A Practical Introduction to Statistics. R package version 1.5.0. https://CRAN.R-project.org/package=languageR