Plot a multi-panel plot of a smooth predictor across multiple QGAMs in a MQGAM
facet_smooth_plot.Rdfacet_smooth_plot creates a multi-panel plot of smooth term plots with confidence intervals using ggplot2.
facet_smooth_plot(
  qgam,
  pred,
  ncol = 1,
  xlab = NULL,
  ylab = "fit",
  scales = "free",
  size = 0.5,
  fill = "steelblue2",
  color = "black",
  alpha = 1)
Arguments
- qgam
An mqgam object created with
qgam::mqgam.- pred
The predictor term to plot. Note: This is no longer identical to the
predargument specified foritsadug::plot_parametric.- ncol
The number of columns of the multi-panel plot.
- xlab
The x-axis label.
- ylab
The y-axis label.
- scales
Should scales be free (
"free", the default) or fixed ("fixed")?- size
Size argument for the ggplot object; specifies the size of the line.
- fill
Color argument for the ggplot object; specifies the color of the confidence interval.
- color
Color argument for the ggplot object; specifies the color of the line.
- alpha
Alpha argument for the ggplot object; specifies the transparency of the confidence interval.
Value
A ggplot object.
References
Fasiolo M., Goude Y., Nedellec R., & Wood S. N. (2017). Fast calibrated additive quantile regression. URL: https://arxiv.org/abs/1707.03307
van Rij J, Wieling M, Baayen R, & van Rijn H (2020). itsadug: Interpreting Time Series and Autocorrelated Data Using GAMMs. R package version 2.4.
Wickham, H. (2016). ggplot2: Elegant Graphics for Data Analysis. Springer-Verlag New York.
Examples
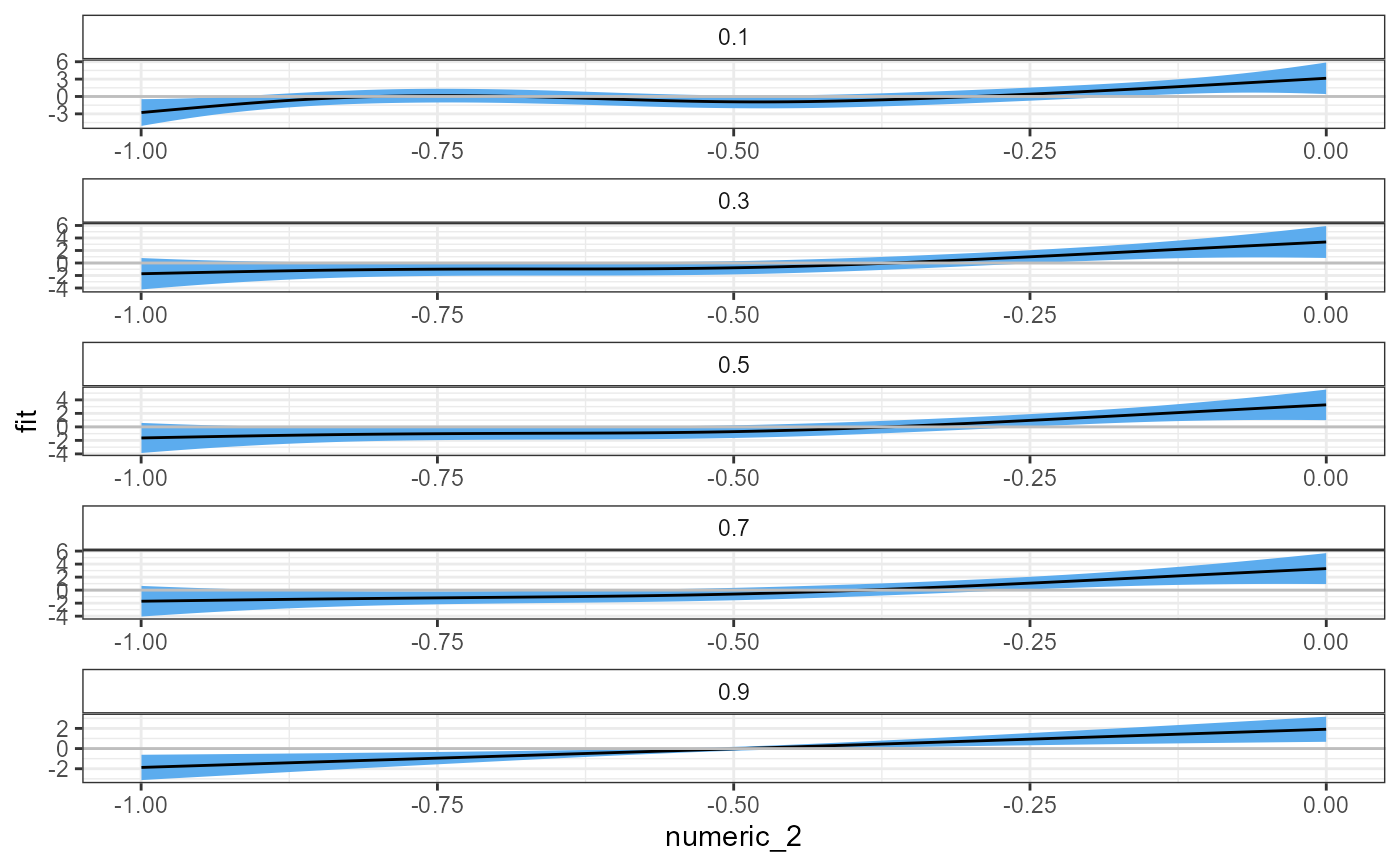
# basic example
facet_smooth_plot(qgam = mtqgam_mqgam,
pred = "numeric_2")
#> i Plotting multi-panel plot for smooth term numeric_2.
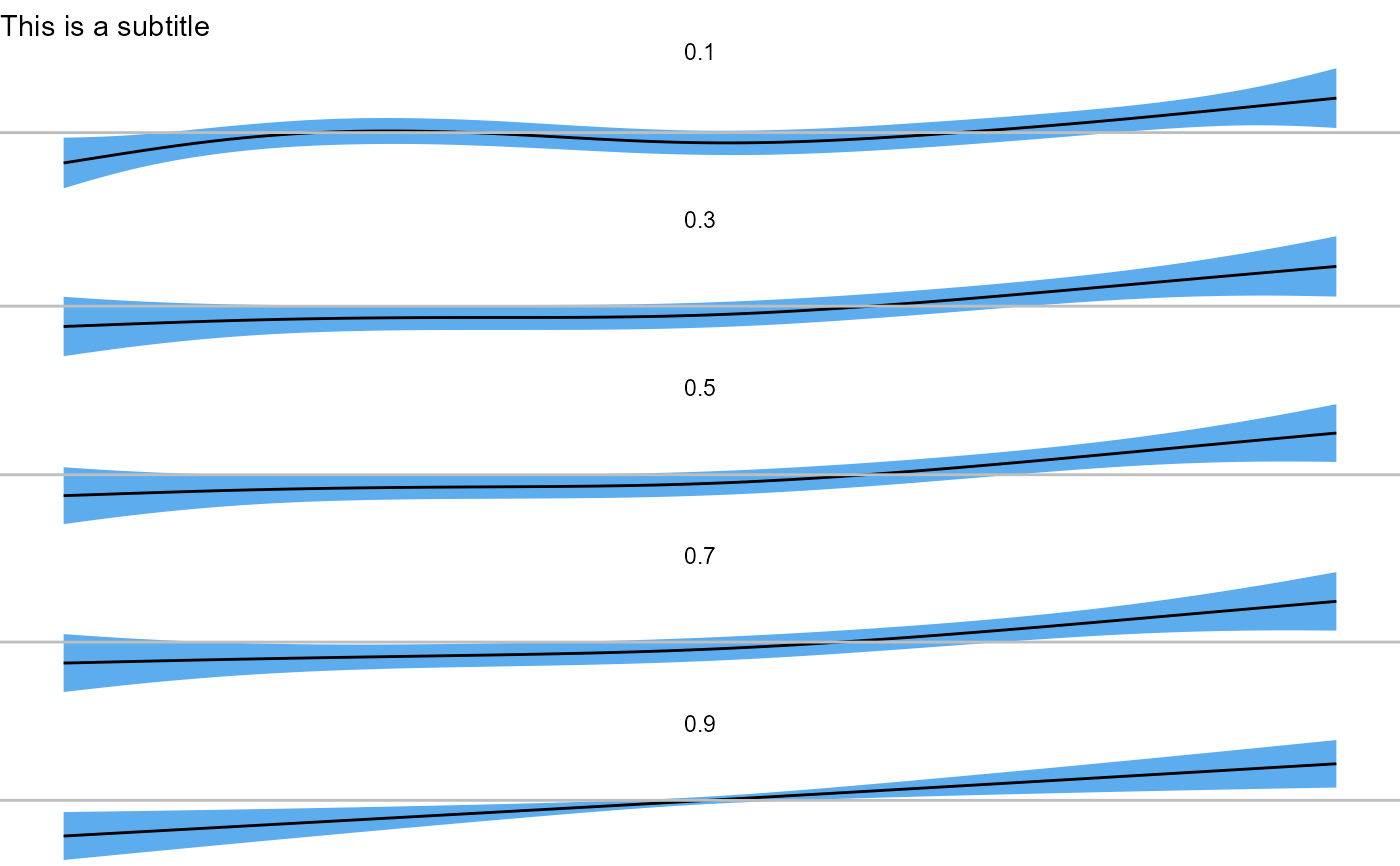
 # combining facet_smooth_plot with ggplot2
facet_smooth_plot(qgam = mtqgam_mqgam,
pred = "numeric_2") +
theme_void() +
labs(subtitle = "This is a subtitle")
#> i Plotting multi-panel plot for smooth term numeric_2.
# combining facet_smooth_plot with ggplot2
facet_smooth_plot(qgam = mtqgam_mqgam,
pred = "numeric_2") +
theme_void() +
labs(subtitle = "This is a subtitle")
#> i Plotting multi-panel plot for smooth term numeric_2.