Plot better plots of smooth predictors in QGAMs
better_smooth_plot.Rdbetter_smooth_plot creates a smooth plot with confidence intervals using ggplot2. It basically is a wrapper for the base plot function.
better_smooth_plot(
  qgam,
  quantile = NULL,
  pred,
  plot.old = FALSE,
  xlab = NULL,
  ylab = "fit",
  size = 0.5,
  fill = "steelblue2",
  color = "black",
  alpha = 1)
Arguments
- qgam
A qgam object created with
qgam::qgamor extracted from aqgam::mqgamobject, or a collection of qgams created withqgam::mqgam.- quantile
If
qgamis a collection of qgam models, specify the quantile you are interested in. Not meaningful for single qgam objects.- pred
The smooth term you wish to plot. Must be one of the smooth terms given in the qgam formula.
- smooth_term
obsolete: Use
predinstead.- plot.old
Plot the original
plotas well.- xlab
The x-axis label.
- ylab
The y-axis label.
- size
Size argument for the ggplot object; specifies the size of the line.
- fill
Color argument for the ggplot object; specifies the color of the confidence interval.
- alpha
Alpha argument for the ggplot object; specifies the transparency of the confidence interval.
- color
Color argument for the ggplot object; specifies the color of the line.
Value
A ggplot object.
References
Fasiolo M., Goude Y., Nedellec R., & Wood S. N. (2017). Fast calibrated additive quantile regression. URL: https://arxiv.org/abs/1707.03307
Wickham, H. (2016). ggplot2: Elegant Graphics for Data Analysis. Springer-Verlag New York.
Examples
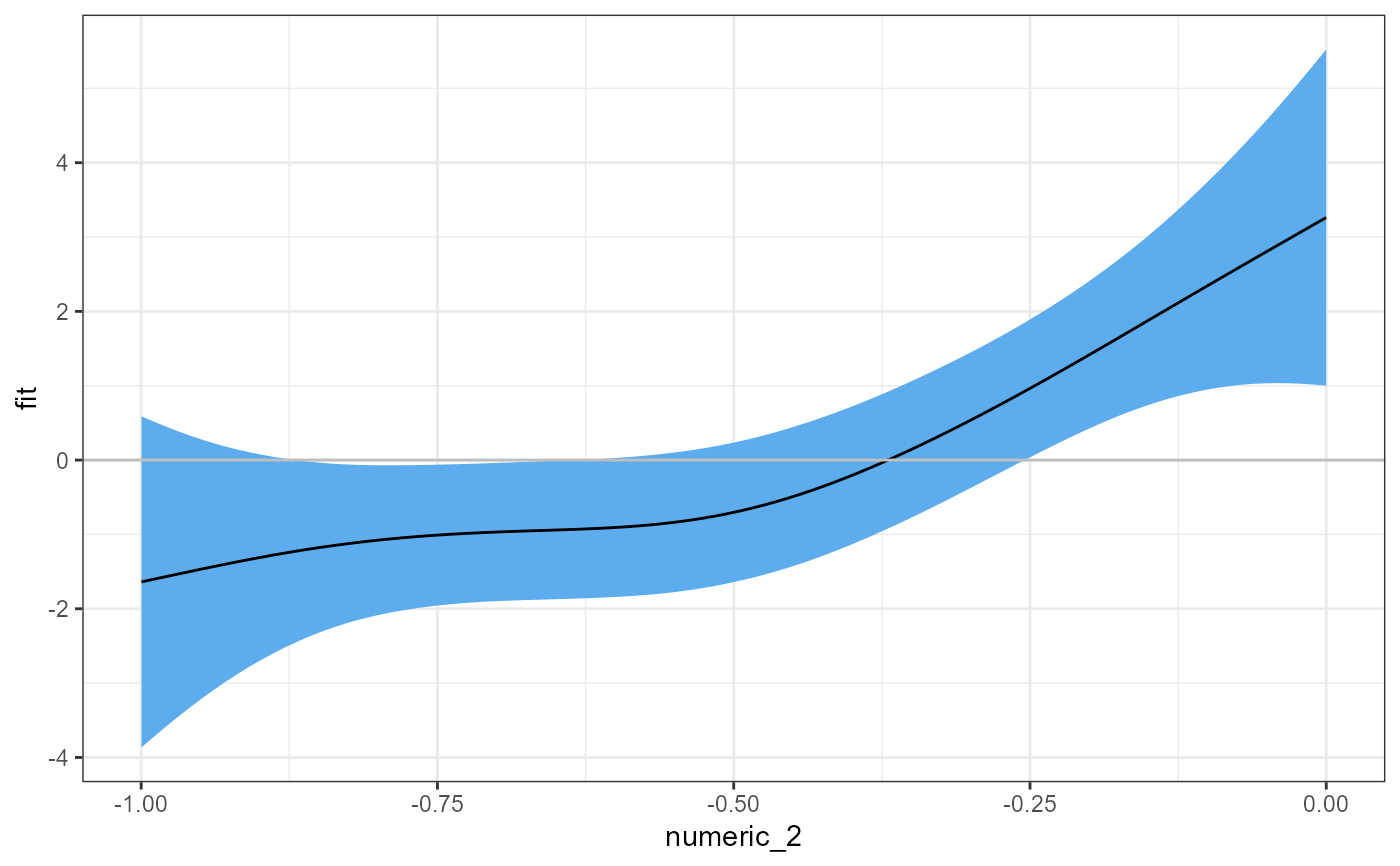
# using a single qgam extracted from an mqgam object OR fitted with qgam::qgam
better_smooth_plot(qgam = mtqgam_qgam,
pred = "numeric_2")
#> i Plotting smooth term numeric_2.
 # using a qgam that is part of an mqgam object
library(qgam)
better_smooth_plot(qgam = mtqgam_mqgam,
quantile = 0.5,
pred = "numeric_2")
#> i Plotting smooth term numeric_2.
# using a qgam that is part of an mqgam object
library(qgam)
better_smooth_plot(qgam = mtqgam_mqgam,
quantile = 0.5,
pred = "numeric_2")
#> i Plotting smooth term numeric_2.
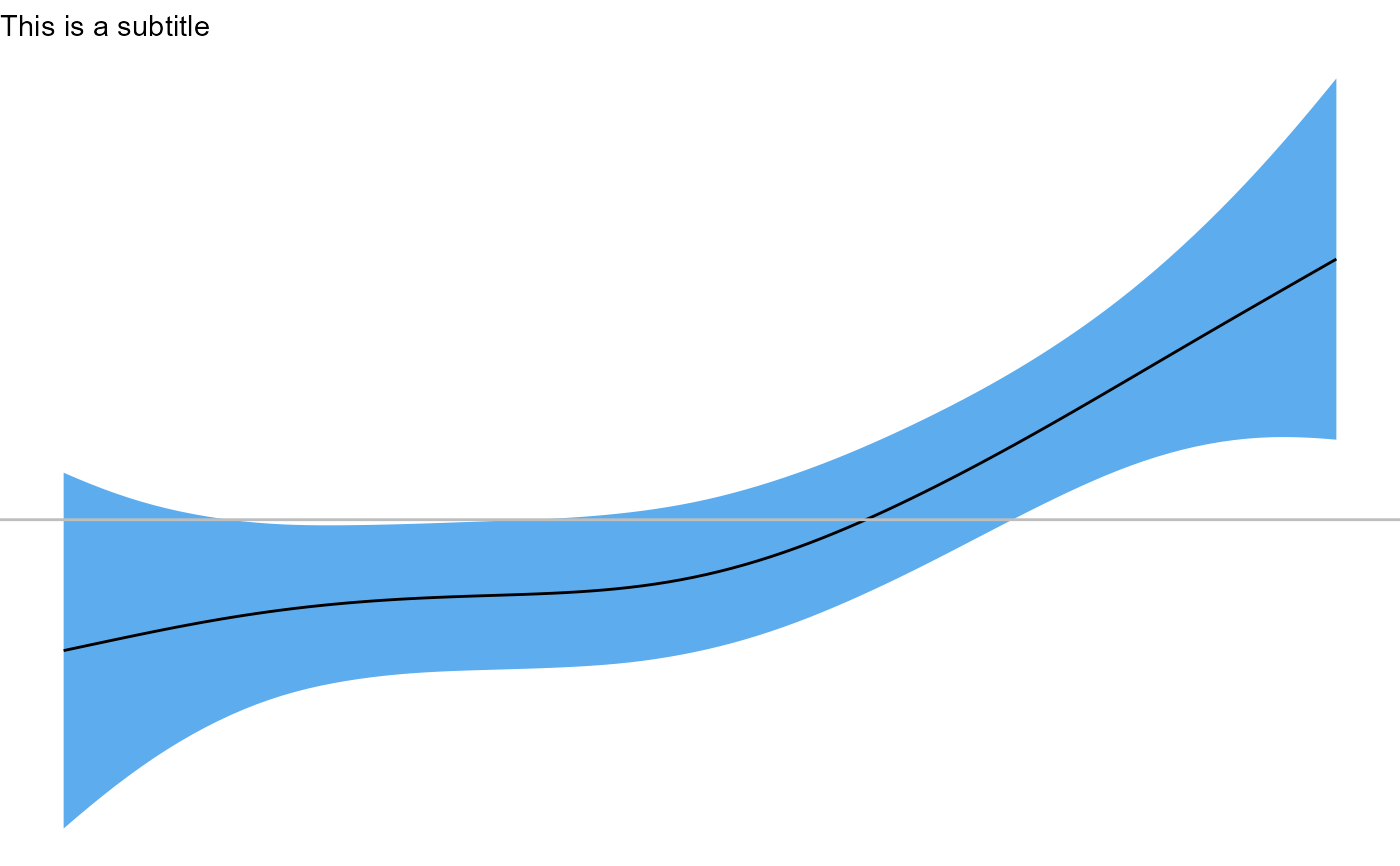
 # combining better_smooth_plot with ggplot2
better_smooth_plot(qgam = mtqgam_qgam,
pred = "numeric_2") +
theme_void() +
labs(subtitle = "This is a subtitle")
#> i Plotting smooth term numeric_2.
# combining better_smooth_plot with ggplot2
better_smooth_plot(qgam = mtqgam_qgam,
pred = "numeric_2") +
theme_void() +
labs(subtitle = "This is a subtitle")
#> i Plotting smooth term numeric_2.