Plot better interaction plots for QGAMs
better_interaction_plot.Rdbetter_interaction_plot creates either a smooth plot with confidence intervals (for numeric:factor interactions) or
a point plot with confidence interval ranges (for factor:factor interactions) using ggplot2.
The underlying functions are similar to better_parametric_plot and better_smooth_plot.
better_interaction_plot(
  qgam,
  quantile = NULL,
  pred,
  cond,
  order,
  ncol = 1,
  type,
  xlab = NULL,
  ylab = NULL,
  scales = NULL,
  size = 0.5,
  fill = NULL,
  color = NULL,
  alpha = 1,
  names = NULL)
Arguments
- qgam
A qgam object created with
qgam::qgamor extracted from aqgam::mqgamobject, or a collection of qgams created withqgam::mqgam.- quantile
If
qgamis a collection of qgam models, specify the quantile you are interested in. Not meaningful for single qgam objects.- pred
The predictor you wish to plot. Must be one of the predictor or smooth terms given in the qgam formula.
- cond
The predictor
predis in interaction with.- order
Specify the order with which the levels given in
predshould be plotted. This is only meaningful for interaction plots of factors.- ncol
The number of columns of the multi-panel plot. This is not meaningful for
type = "no_facet"plots.- type
For interaction plots of two numeric variables, choose either
"facet"(the default) or"no_facet". This is only meaningful for interaction plots of numeric variables.- xlab
The x-axis label.
- ylab
The y-axis label.
- scales
Should scales be fixed (
"fixed", the default) or free ("free")? This is not meaningful fortype = "no_facet"plots.- size
Size argument for the ggplot object; specifies the size of the line / the size of the point and whiskers.
- fill
Color argument for the ggplot object; specifies the color of the confidence interval. This is only meaningful for interaction plots of numeric variables.
- color
Color argument for the ggplot object; specifies the color of the lines and dots. For interaction plots of factors, this must be a vector of colors with a length equal to the combinations of factor levels. For interaction plots of numeric variables and factors, this is a single color.
- alpha
Alpha argument for the ggplot object; specifies the transparency of the confidence interval for interaction plots of numeric variables, and specifies the transparency of point and whiskers for interaction plots of interaction plots for factors. The value of
alphais changed to0.5by default forno_facetplots.- names
Strings used as facet labels.
Value
A ggplot object.
References
Fasiolo M., Goude Y., Nedellec R., & Wood S. N. (2017). Fast calibrated additive quantile regression. URL: https://arxiv.org/abs/1707.03307
van Rij J, Wieling M, Baayen R, & van Rijn H (2020). itsadug: Interpreting Time Series and Autocorrelated Data Using GAMMs. R package version 2.4.
Wickham, H. (2016). ggplot2: Elegant Graphics for Data Analysis. Springer-Verlag New York.
Examples
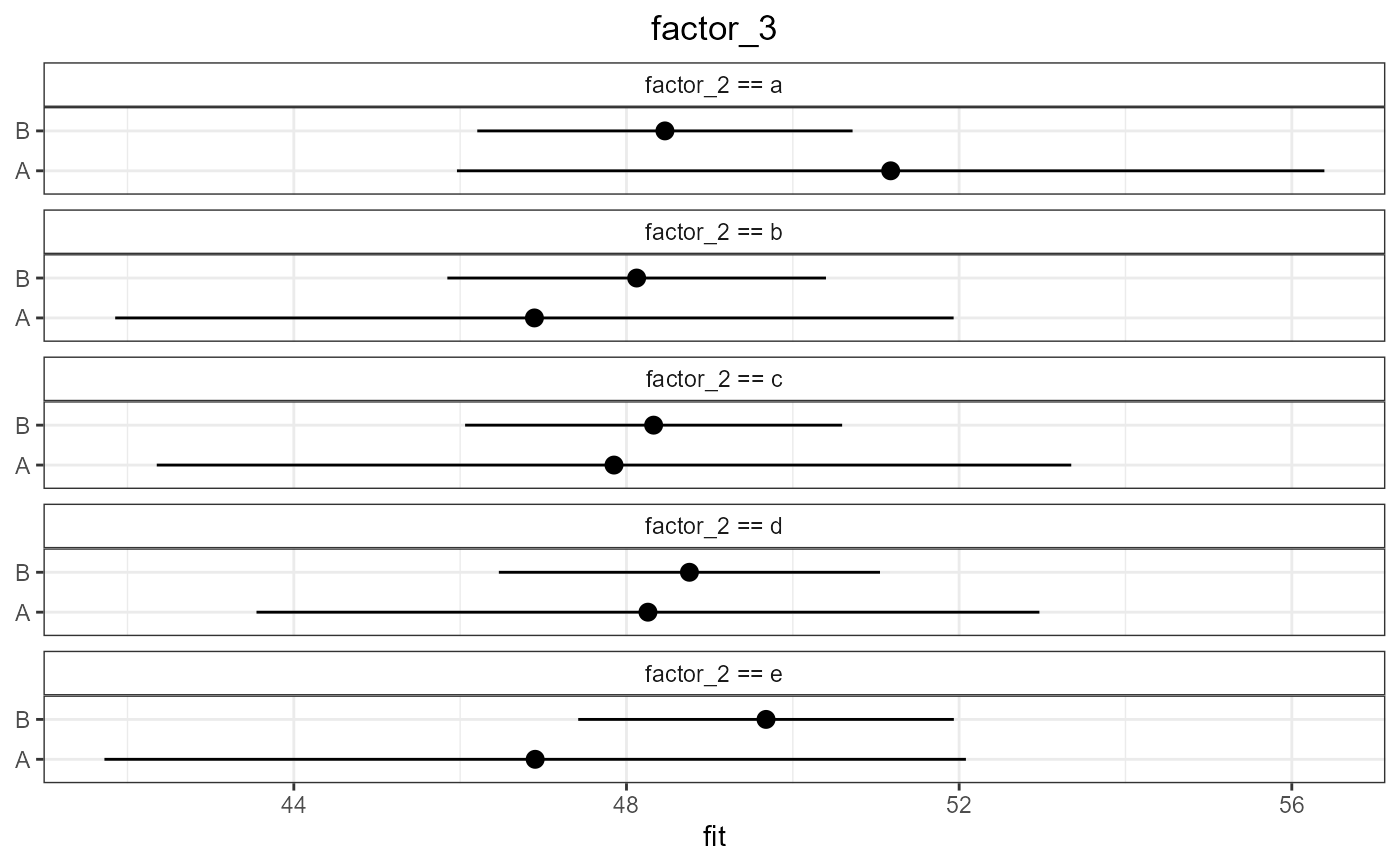
### examples for factor:factor interactions
# using a single qgam extracted from an mqgam object OR fitted with qgam::qgam
better_interaction_plot(qgam = mtqgam_qgam,
pred = "factor_3",
cond = "factor_2")
#> Loading required package: ggplot2
 # using a qgam that is part of an mqgam object
better_interaction_plot(qgam = mtqgam_mqgam,
quantile = 0.5,
pred = "factor_3",
cond = "factor_2")
# using a qgam that is part of an mqgam object
better_interaction_plot(qgam = mtqgam_mqgam,
quantile = 0.5,
pred = "factor_3",
cond = "factor_2")
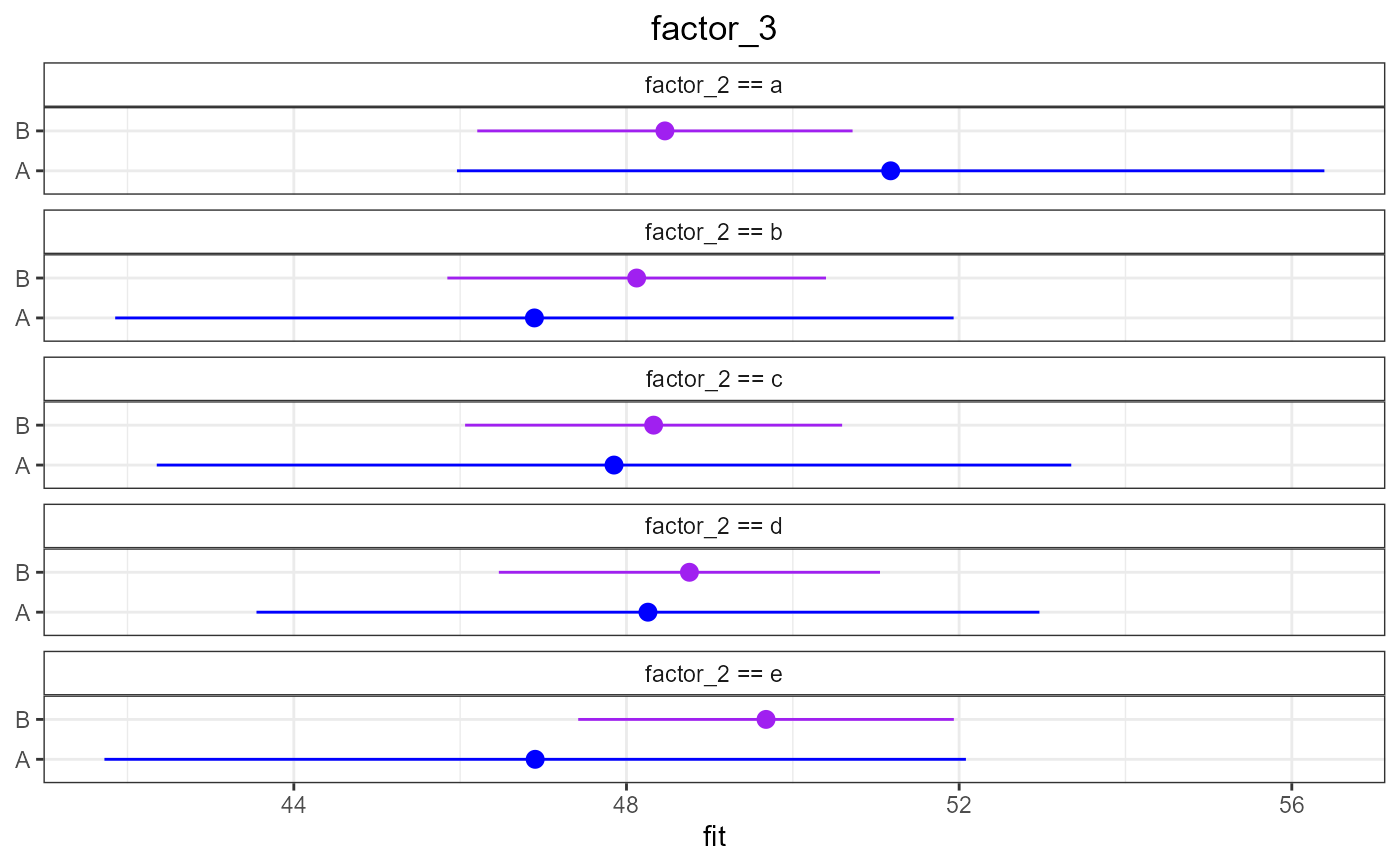
 # specifying color
better_interaction_plot(qgam = mtqgam_qgam,
pred = "factor_3",
cond = "factor_2",
color = c("blue", "purple"))
# specifying color
better_interaction_plot(qgam = mtqgam_qgam,
pred = "factor_3",
cond = "factor_2",
color = c("blue", "purple"))
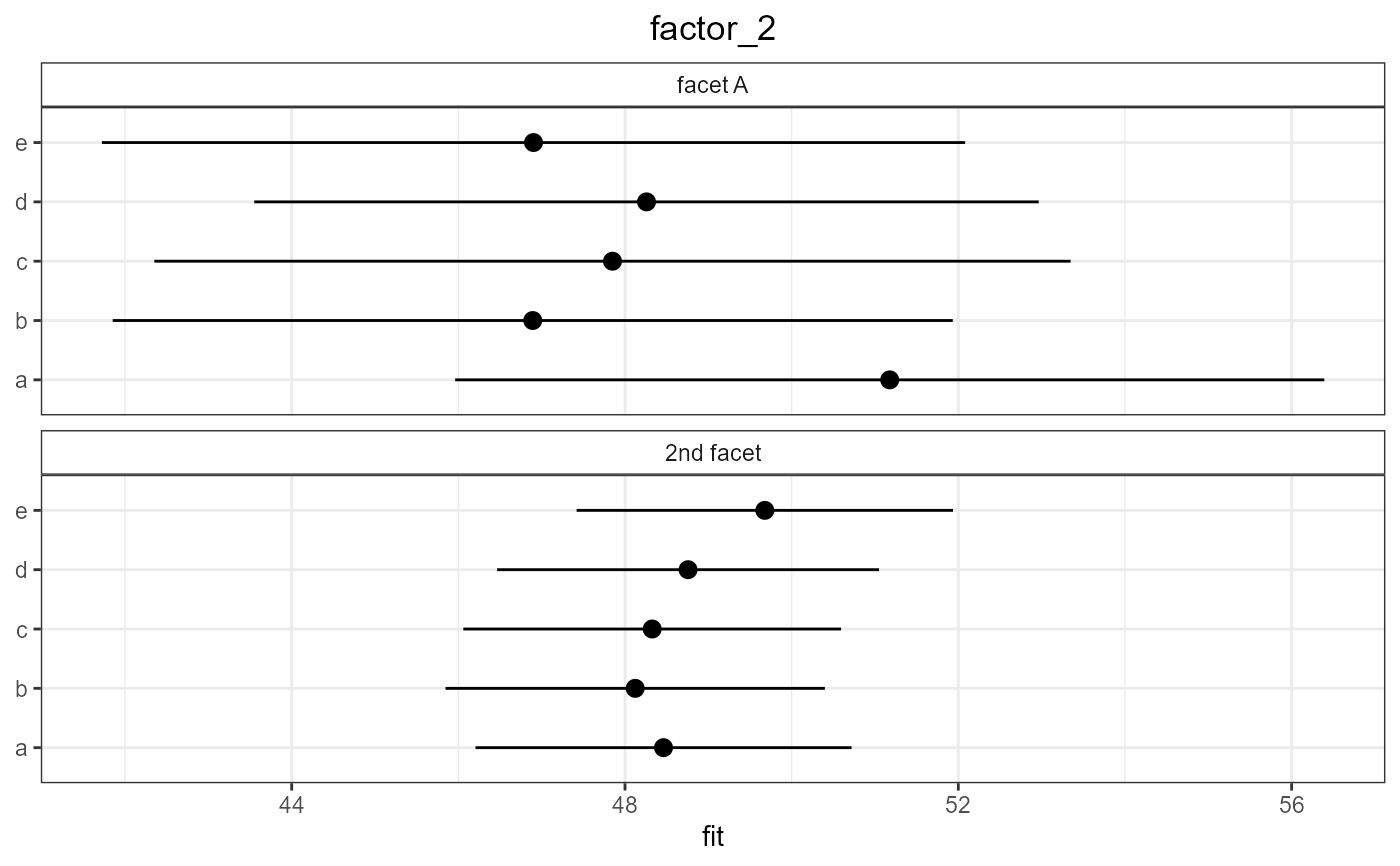
 # specifying facet labels
better_interaction_plot(qgam = mtqgam_qgam,
pred = "factor_2",
cond = "factor_3",
names = c("facet A", "2nd facet"))
# specifying facet labels
better_interaction_plot(qgam = mtqgam_qgam,
pred = "factor_2",
cond = "factor_3",
names = c("facet A", "2nd facet"))
 # combining better_interaction_plot with ggplot2
better_interaction_plot(qgam = mtqgam_qgam,
pred = "factor_3",
cond = "factor_2") +
theme_void() +
labs(subtitle = "This is a subtitle")
# combining better_interaction_plot with ggplot2
better_interaction_plot(qgam = mtqgam_qgam,
pred = "factor_3",
cond = "factor_2") +
theme_void() +
labs(subtitle = "This is a subtitle")
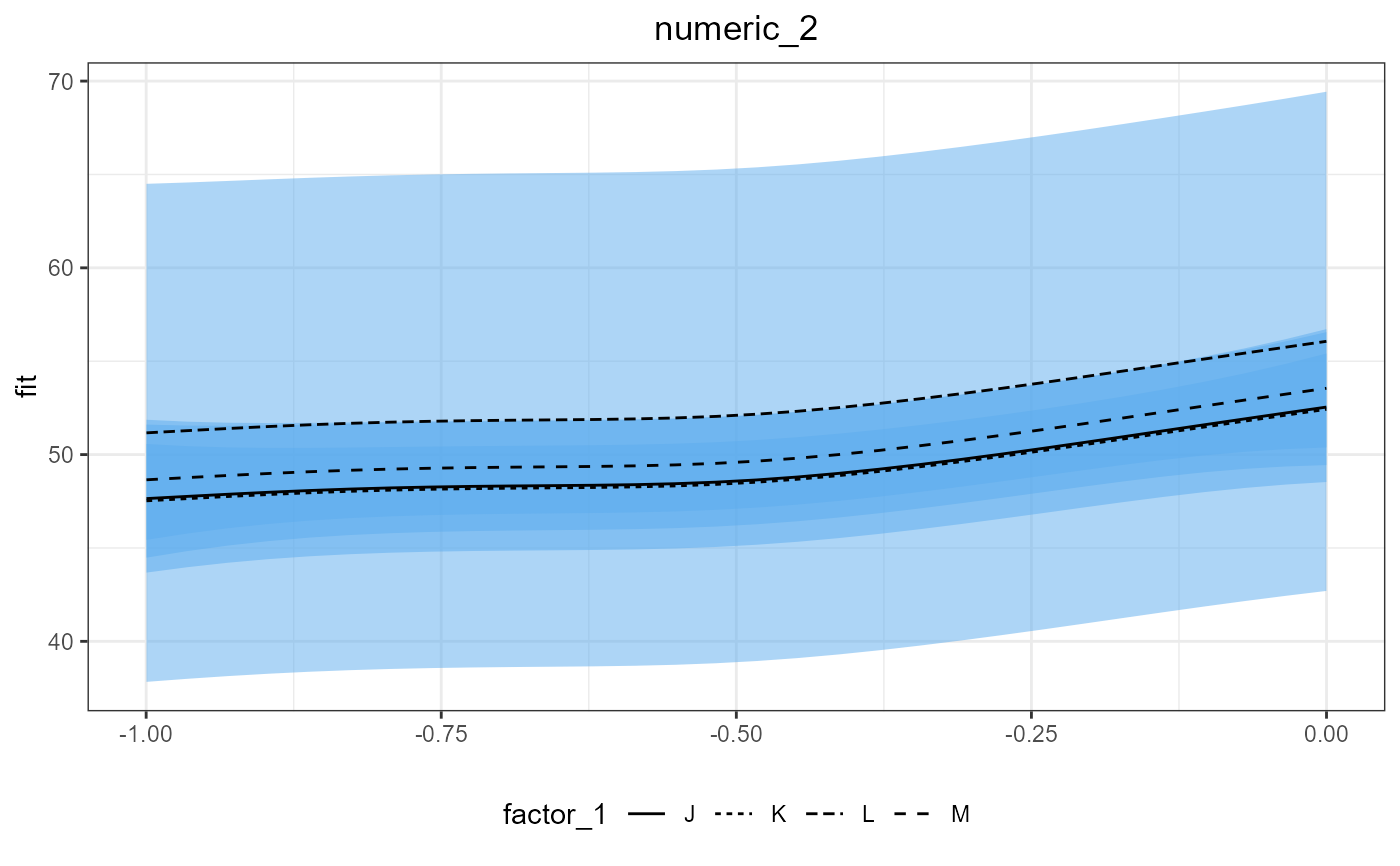
 ### examples for numeric:factor interactions
# using a single qgam extracted from an mqgam object OR fitted with qgam::qgam
better_interaction_plot(qgam = mtqgam_qgam,
pred = "numeric_2",
cond = "factor_1")
#> Error in facet_names[[a]] <- label: attempt to select less than one element in integerOneIndex
better_interaction_plot(qgam = mtqgam_qgam,
pred = "numeric_2",
cond = "factor_1",
type = "no_facet")
#> ! The ncol argument is not meaningful for no_facet interaction plots of smooth terms. Plotting anyway.
#> ! Changing alpha to 0.5 for better legibility.
### examples for numeric:factor interactions
# using a single qgam extracted from an mqgam object OR fitted with qgam::qgam
better_interaction_plot(qgam = mtqgam_qgam,
pred = "numeric_2",
cond = "factor_1")
#> Error in facet_names[[a]] <- label: attempt to select less than one element in integerOneIndex
better_interaction_plot(qgam = mtqgam_qgam,
pred = "numeric_2",
cond = "factor_1",
type = "no_facet")
#> ! The ncol argument is not meaningful for no_facet interaction plots of smooth terms. Plotting anyway.
#> ! Changing alpha to 0.5 for better legibility.
 # specifying color
better_interaction_plot(qgam = mtqgam_qgam,
pred = "numeric_2",
cond = "factor_1",
color = "blue", "purple")
#> ! The quantile argument is not meaningful for single QGAM objects. Plotting anyway.
#> Error in facet_names[[a]] <- label: attempt to select less than one element in integerOneIndex
# using a qgam that is part of an mqgam object
better_interaction_plot(qgam = mtqgam_mqgam,
quantile = 0.5,
pred = "numeric_2",
cond = "factor_1")
#> Error in facet_names[[a]] <- label: attempt to select less than one element in integerOneIndex
# combining better_interaction_plot with ggplot2
better_interaction_plot(qgam = mtqgam_qgam,
pred = "numeric_2",
cond = "factor_1") +
theme_void() +
labs(subtitle = "This is a subtitle")
#> Error in facet_names[[a]] <- label: attempt to select less than one element in integerOneIndex
# specifying color
better_interaction_plot(qgam = mtqgam_qgam,
pred = "numeric_2",
cond = "factor_1",
color = "blue", "purple")
#> ! The quantile argument is not meaningful for single QGAM objects. Plotting anyway.
#> Error in facet_names[[a]] <- label: attempt to select less than one element in integerOneIndex
# using a qgam that is part of an mqgam object
better_interaction_plot(qgam = mtqgam_mqgam,
quantile = 0.5,
pred = "numeric_2",
cond = "factor_1")
#> Error in facet_names[[a]] <- label: attempt to select less than one element in integerOneIndex
# combining better_interaction_plot with ggplot2
better_interaction_plot(qgam = mtqgam_qgam,
pred = "numeric_2",
cond = "factor_1") +
theme_void() +
labs(subtitle = "This is a subtitle")
#> Error in facet_names[[a]] <- label: attempt to select less than one element in integerOneIndex